Piloting automated test executions from Squash TM
Squash test case automation
Info
This page describes the operations common to all supported test frameworks. You can access the automation specificities for each technology directly with the following links:
One technology per Git repository
Squash Orchestrator currently supports only one test technology per Git repository.
Specifically, it is not possible to launch a test iteration/suite containing tests from the same Git repository but using different technologies.
Without using the Squash automation workflow
To execute a test case using the Squash Orchestrator, its Automation block in the Information tab of the test case page must be correctly filled:
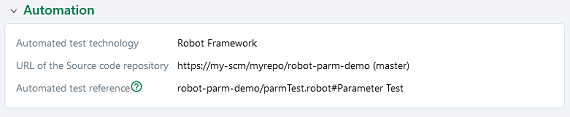
-
Automated test technology: A dropdown list allowing you to choose the technology used for the execution of a test case. -
Source code repository URL: The address of the source code repository where the project is located, as referenced in the Source code management servers area of the Administration. -
Automated test reference: This is the location of the automated test within the project. This reference must follow the specific format of the used test technology.
Using the Squash automation workflow
Regular test case
To execute a test case using the Squash Orchestrator, it must be automated in the Automation Workspace by filling three columns:

-
TECHNO.: A dropdown list allowing you to choose the technology used for the execution of a test case. -
SCM URL: The address of the source code repository where the project is located. -
REF. OF THE AUTO TEST: This is the location of the automated test within the project. This reference must follow the specific format of the used test technology.
BDD or Gherkin test case
The information of the Automation block is automatically filled during the transmission of a BDD or Gherkin script to a remote source code repository hosting service. It can also be modified by the user at any moment.
Squash TM parameters exploitation
When a Squash execution plan is launched (from Squash TM or a CI/CD pipeline), Squash will transmit various information on execution plan item that can be exploited by a test case.
The following frameworks can exploit Squash TM parameters during test execution:
Each of these pages describes the parameters that can be retrieved by the test script and how to retrieve them.
Automated suite execution
The steps to run an automated test plan in Squash TM are the usual ones:
-
Navigate to the execution plan of the chosen iteration or test suite.
-
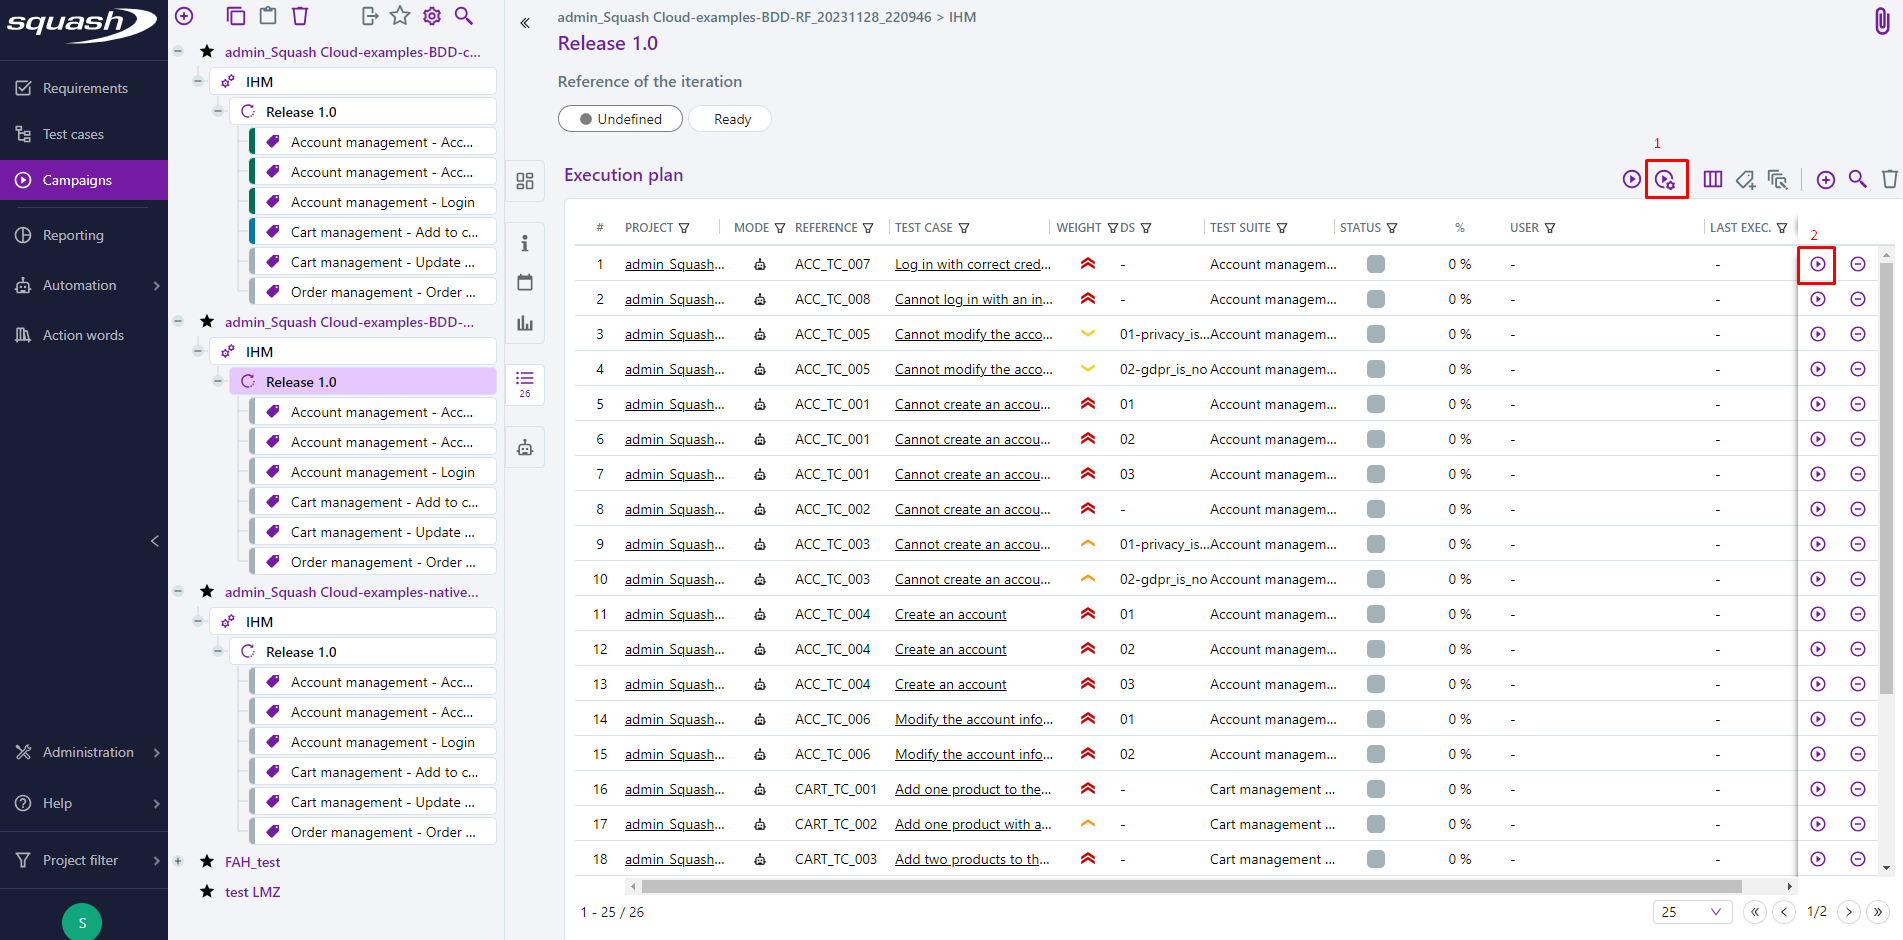
Select the automated tests using one of the buttons in the image below:
Button 1 launches all automated tests or the currently selected tests.
Button 2 launches a specific test.
-
A launch popup appears.
It allows the definition of tags to select execution environments and the modification of the environment variables communicated to the automated tests.
(See Squash TM documentation for more details.)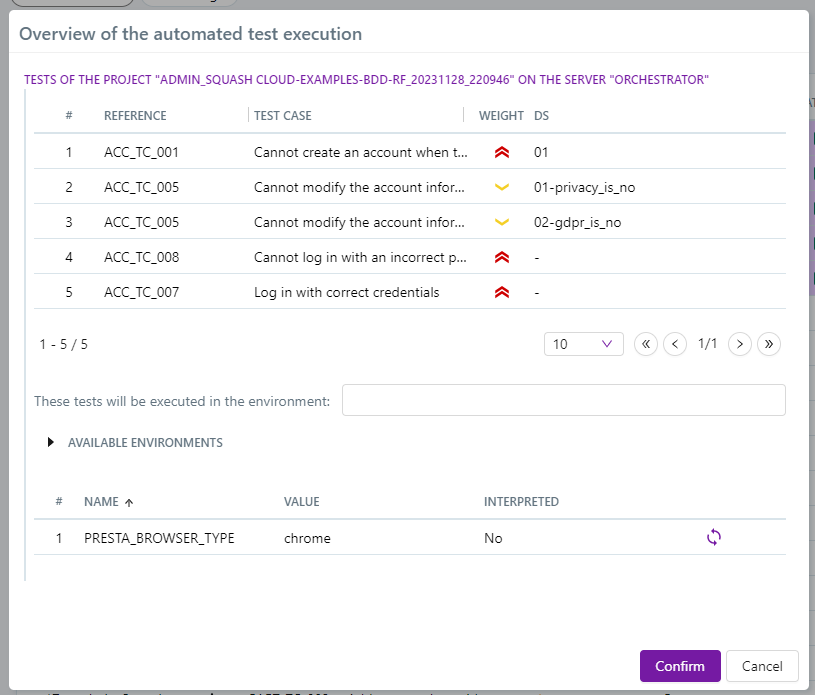
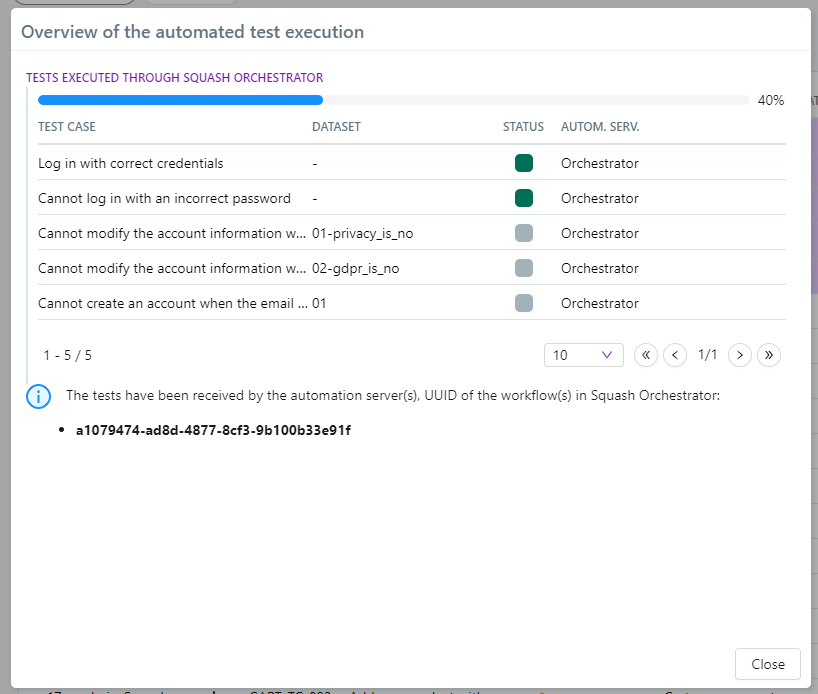
-
Once the tests are launched, their results are displayed progressively as they are executed in the same popup. This popup should not be closed, as Squash TM does not currently allow reopening it.
Older Versions of Squash TM
For older versions of Squash TM (4.X.Y and 5.X.Y), there was no real-time reporting of the results for each test: the user would close the popup, which became useless, once the tests were launched.
Execution order of tests
The only order assured by Squash is that, for a given Git repository in a given iteration/test suite, the tests will be executed in the order defined in Squash TM.
If a test iteration/suite contains automated tests belonging to multiple Git repositories, the order of execution of tests from one repository relative to the execution of tests from another repository is undefined.
If several test iterations/suites are launched from Squash TM (resp. the CI/CD pipeline), the order of execution of the tests of one iteration/suite relative to the execution of the tests of another iteration/suite is undefined. (Except in the trivial case where a suitable execution environment is available and the first suite/iteration was able to start before the Squash TM user – resp. the CI/CD pipeline – launches another one.)
Publication of the results of an execution plan
During the execution of a test plan (from Squash TM or from a CI/CD pipeline):
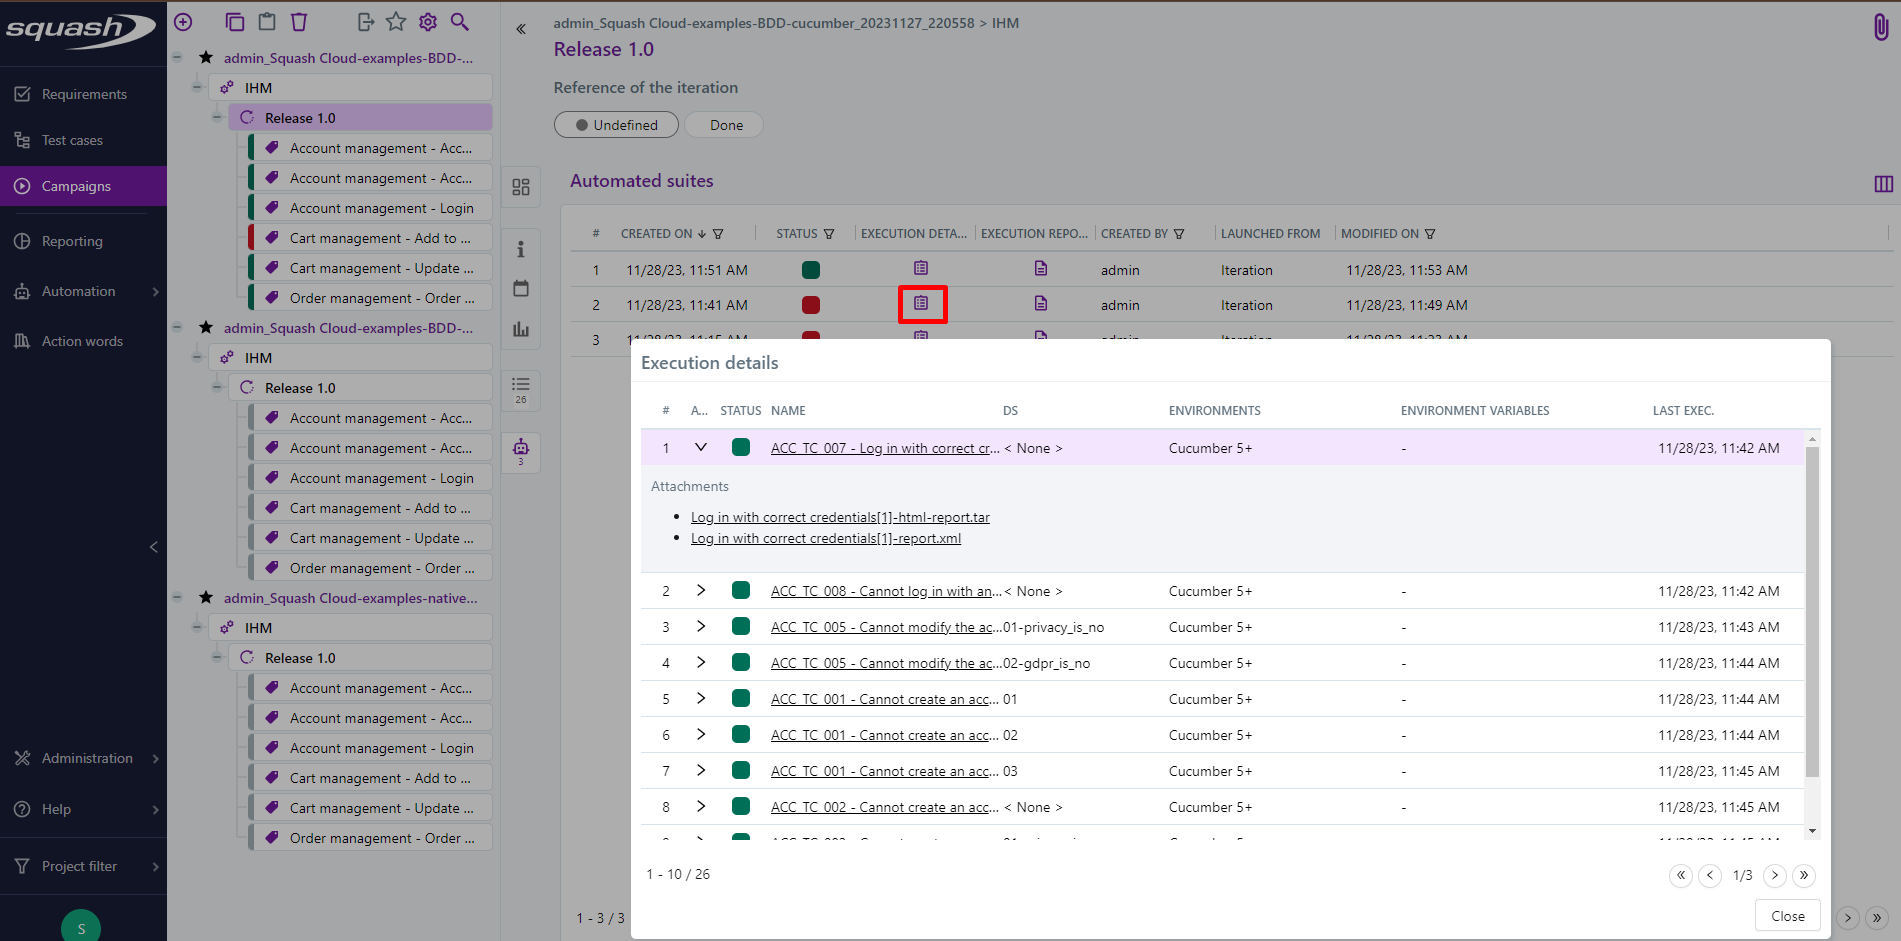
- A new execution is created for each ITPI (Iteration Test Plan Item, see the Squash TM glossary) as each test is executed. It has a status corresponding to the result of the automated test:
Success,Failure, orBlocked. Execution reports and attachments for the automated test are available from the Automated suites tab.
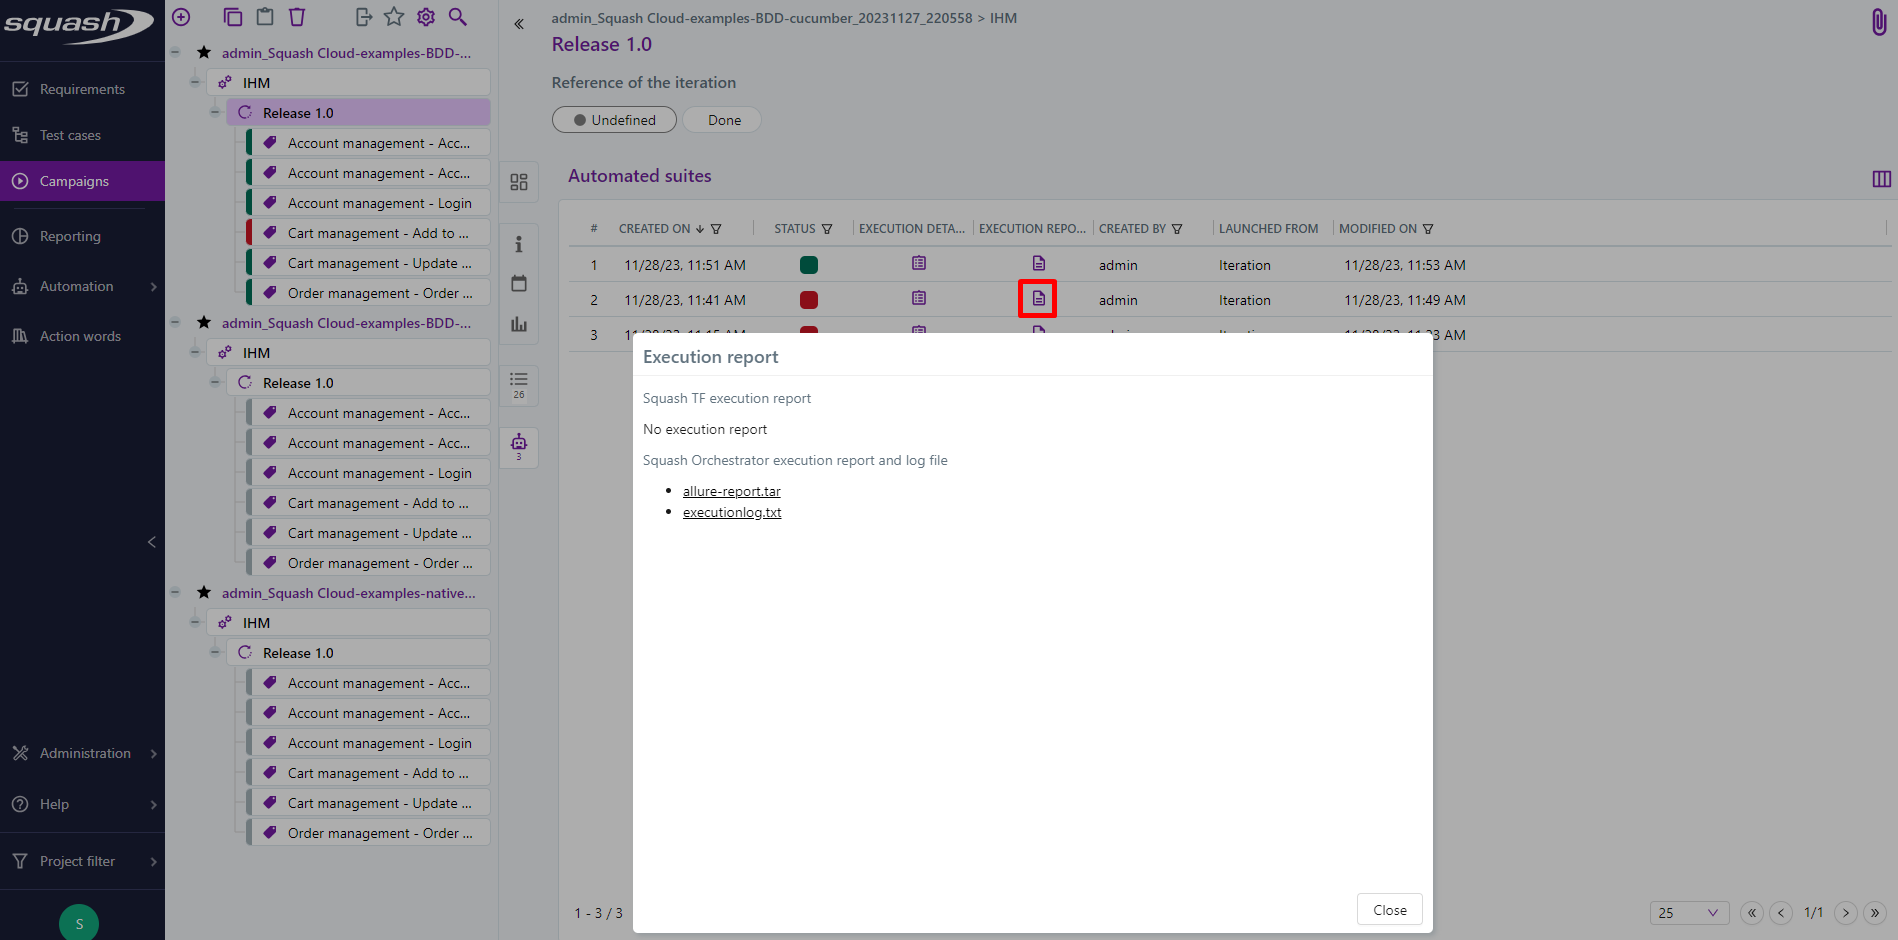
- When all tests in the automated suite have been executed, the status of this one is updated.
An Allure format report (allure-report.tarfile) and the logs of Squash Orchestrator (executionlog.txtfile) for all executed tests are available from the Automated suites tab.
For more information on how to use this report, please refer to the Allure documentation.
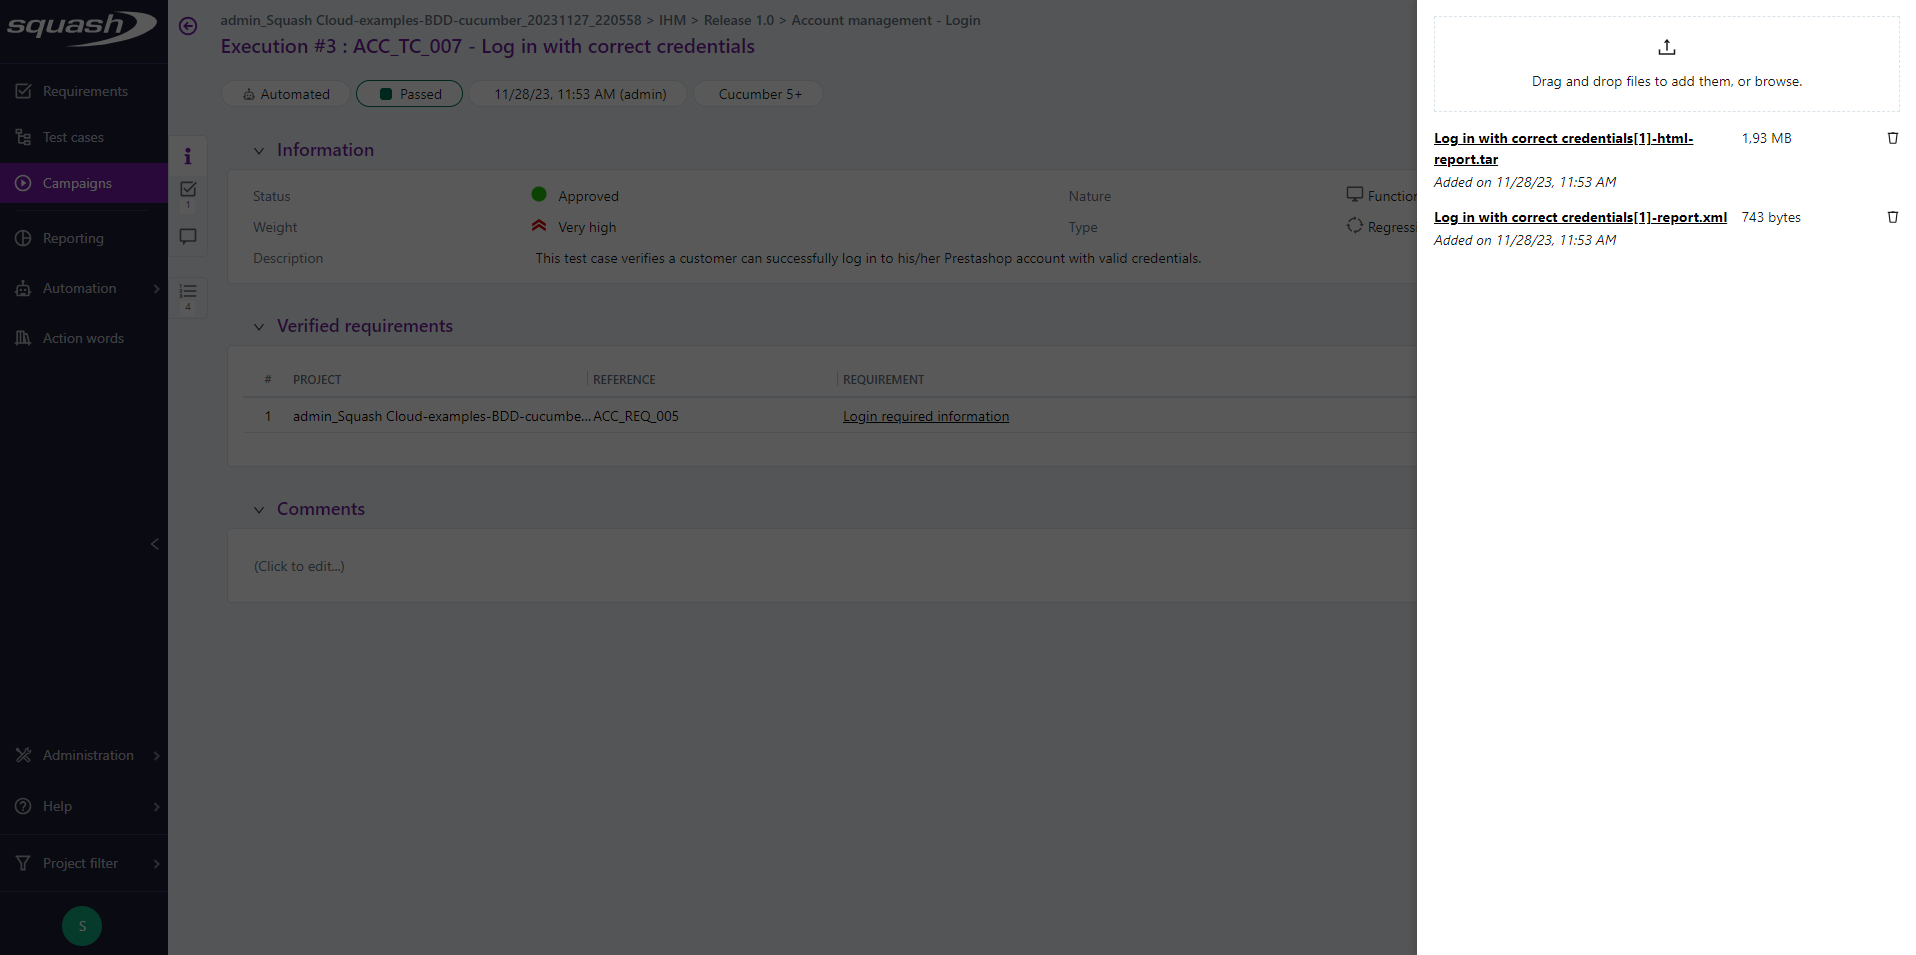
Reports and attachments for the different executions are also accessible from the Execution screen (they are present in the attached files).
Older Versions of Squash TM
For older versions of Squash TM (4.X.Y and 5.X.Y), a light results publication mode was available.
In that mode, only the last execution of an ITPI was retained, and reports and attachments were not accessible from the execution viewing screen.
This mode was
- mandatory for Squash AUTOM Community users
- optional for Squash AUTOM Premium users
(It could be configured in the Result Publisher Squash plugin configuration from the Plugins tab on the project viewing page.)
Legend
️💎 indicates an Ultimate component or feature. An overview of the Premium and Ultimate features is available here. To benefit from these or to ask for more information, check our website or contact us.